This project performs end-to-end customer segmentation using the RFM (Recency, Frequency, Monetary) framework, enriched with Customer Lifetime Value (CLV) analysis.
The objective is to help businesses identify high-value customers, loyal buyers, potential growth segments, at-risk customers, and churned customers, enabling more focused retention and marketing strategies.
The project follows a real-world analytics workflow — SQL → Python → SQL → Python → Power BI — similar to processes used in e-commerce and retail organizations.
Many businesses treat all customers the same, without understanding:
- Which customers generate the most revenue
- Who buys frequently vs. occasionally
- Which customers are likely to churn
- Where marketing spend actually delivers value
This leads to inefficient marketing spend, poor retention, and revenue loss.
I built this project to demonstrate how data-driven customer segmentation can directly support better business decisions, especially around retention and growth.
In e-commerce and retail:
- Customer acquisition is expensive
- Retention is more cost-effective than acquisition
- Not all customers contribute equally to revenue
The business needs clarity on:
- Customer value distribution
- Loyalty and repeat purchase behavior
- Churn risk and future revenue potential
RFM and CLV analysis provide a structured way to answer these questions.
Analyze transactional customer data to segment customers based on Recency, Frequency, and Monetary value, enrich the segmentation with Customer Lifetime Value, and provide actionable insights to improve retention, targeting, and marketing efficiency.
Before analysis, the following hypotheses were framed:
- H1: A small percentage of customers contribute the majority of revenue
- H2: Loyal customers purchase more frequently and have higher CLV
- H3: Recently inactive customers present a higher churn risk
- H4: Some low-frequency customers still show high future value
These hypotheses guided the segmentation and analysis process.
-
Dataset Source: Kaggle – Retail Insights Dataset
-
Dataset Link:
https://www.kaggle.com/datasets/rajneesh231/retail-insights-a-comprehensive-sales-dataset -
Level of Analysis: Customer-level
-
Data Type: Transactional sales data
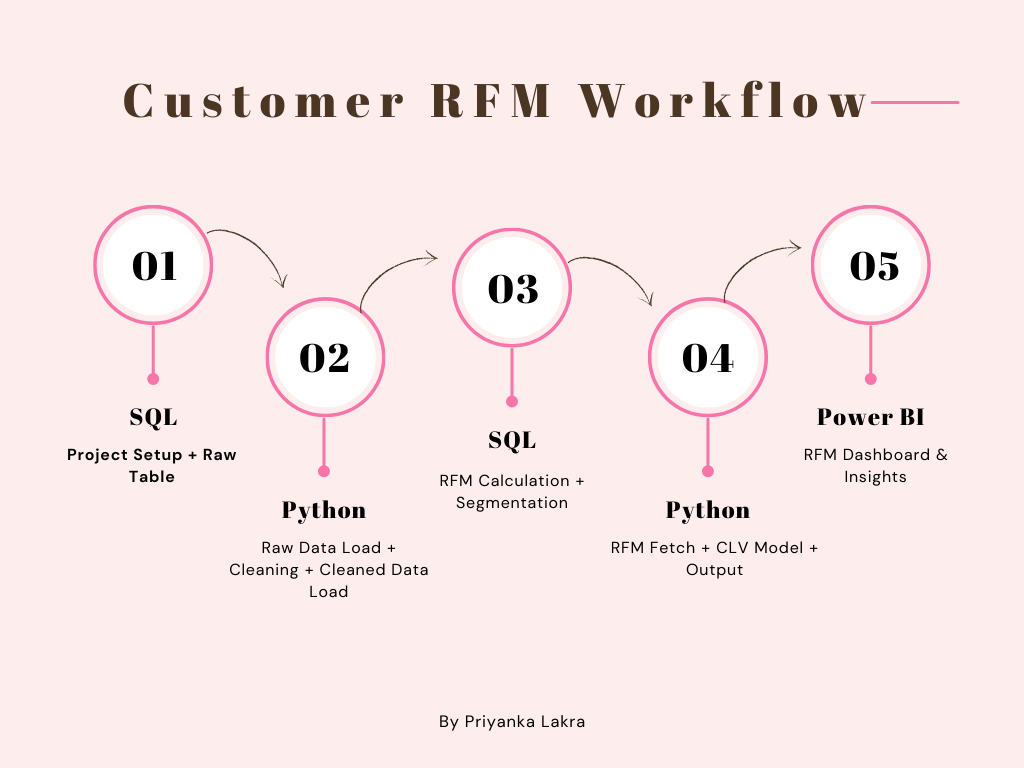
Workflow Used:
SQL → Python → SQL → Python → Power BI
- Created transactional tables
- Validated raw data structure
- Prepared data for preprocessing
- Removed duplicate records
- Handled missing values
- Standardized date formats
- Exported cleaned data back to SQL
- Calculated Recency, Frequency, Monetary metrics
- Assigned NTILE-based scores (1–5)
- Created customer segments
- Imported RFM output
- Computed Customer Lifetime Value (CLV)
- Enriched segmentation with retention indicators
- Exported final dataset for BI
- Built RFM segmentation dashboard
- Added CLV-based visuals
- Created segment-wise KPIs and summaries
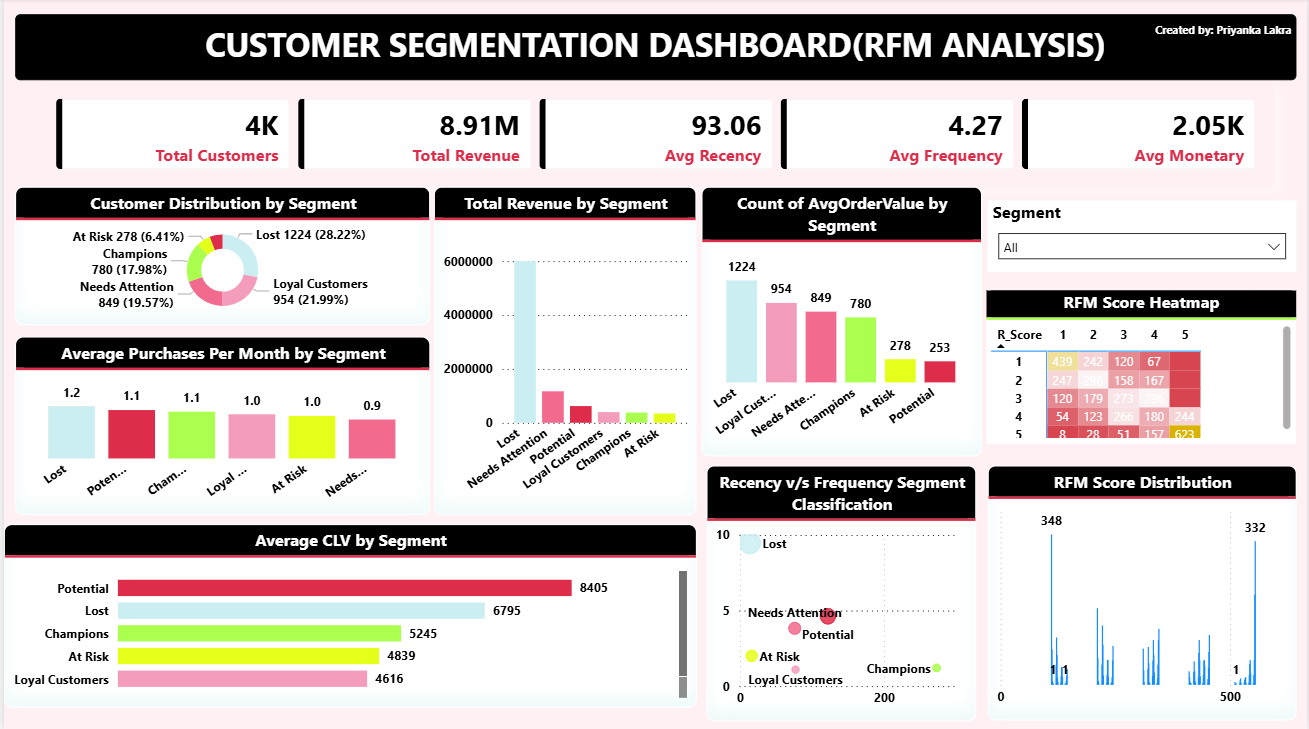
The Power BI dashboard provides:
- Customer segmentation overview
- RFM score distribution
- CLV comparison across segments
- Identification of high-value and at-risk customers
- Recency Score
- Frequency Score
- Monetary Score
- Customer Segment
- Customer Lifetime Value (CLV)
- Champions and Loyal customers generate the majority of revenue
- Lost customers form a large segment but contribute minimal value
- Potential customers show high future value based on CLV
- Many customers have low recency, indicating retention challenges
- Loyal customers purchase more frequently and consistently
- CLV highlights which segments are worth investing in
- Enables targeted marketing instead of mass campaigns
- Helps reduce churn by identifying at-risk customers early
- Improves retention strategy through segment-level insights
- Optimizes marketing spend by focusing on high-value customers
- Champions: Retain with exclusive rewards and premium offers
- Loyal: Strengthen loyalty with cross-sell and upsell campaigns
- Potential: Convert with onboarding journeys and targeted discounts
- At Risk: Re-engage with win-back strategies
- Needs Attention: Encourage repeat purchases with incentives
- Lost: Use low-cost outreach only; avoid heavy spending
Overall: Focus marketing budget on high-value and high-CLV segments.
Customer behavior varies significantly across segments.
Using RFM + CLV analysis allows businesses to shift from generic marketing to data-driven customer intelligence, improving retention, reducing churn, and maximizing lifetime value.
- Python (pandas, numpy, matplotlib, seaborn)
- SQL (MySQL) – segmentation, scoring, aggregation
- Power BI – dashboard creation
- Jupyter Notebook – EDA and modeling
Priyanka Lakra
Aspiring Data Analyst | SQL | Python | Power BI
Focused on solving business problems using analytics.